
This how-to article accompanies an article explaining how to use sensor probeware to generate graphs and data for school lab reports. It describes how to control the graphs (which are really PICT files) and the data (which is tab-delimited number data) when you paste it into AppleWorks.
This article specifically covers AppleWorks 5, but the process for version 6 should be quite similar from what I have seen, and it also works for ClarisWorks 4, which, after all, is the same program as AppleWorks 5. It may also apply to earlier versions, but they have not been tested.
Inserting a PICT
When you paste a PICT file you have copied from another program into AppleWorks, it can enter the word processor file as either an inline graphic or a floating graphic. An inline graphic behaves just as a giant letter of a tremendous font would. A floating graphic can cover up what is behind it, or text can be made to float around it.
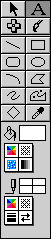 The key is to use the tools that appear on the left side of a word processor document.
 1. Copy the graphic you want to paste to the clipboard (Cmd-C or Copy in the File menu).
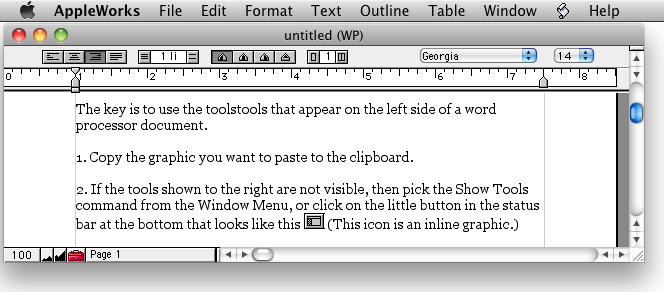
2. If the tools shown to the right are not visible, then pick the Show Tools command from the Window Menu, or click on the little button in the status bar at the bottom that looks like this: ![]() (This icon is an inline graphic.)
(This icon is an inline graphic.)
3. Next, for an inline graphic, select the text tool “A” button, click the mouse so the cursor appears where you want the graphic to appear, and paste (Cmd-V or Paste in the File menu). Now you have an inline graphic that behaves as a giant letter of the alphabet. You can backspace over it to delete it, you can center it or left justify it, and you can change its size by clicking on it once and moving the sizing square in the lower right corner.
Inline graphic in AppleWorks 6 running in OS X 10.6 Snow Leopard.
The most annoying thing about inline graphics is that since they behave like a single letter of the alphabet, only one line of text can appear beside them. I struggled for many months fighting with tables, alignment settings, and so on, until I discovered you could paste a graphic as an object to avoid this problem. (The graphic of the toolbar above right is a floating graphic.)
Why didn’t I read the manual? Because our district has a site license, we don’t get one. Besides, I’m a Mac user: If I can’t figure it out myself, the software must be badly designed. ;-)
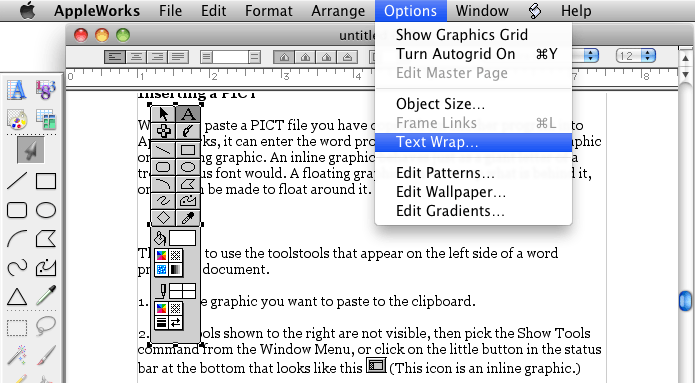
You can insert a graphic as an object in AppleWorks and then make text flow around it.

Text can flow around an object.
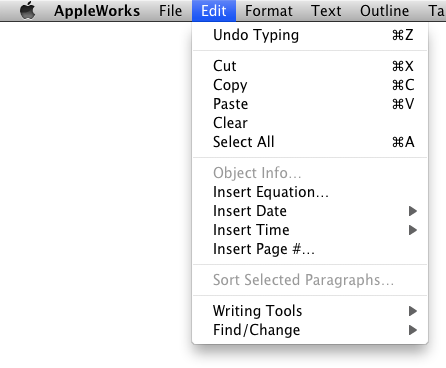
4. To insert a graphic as an object, click the object tool (arrow button) on the tools and then paste your graphic. The graphic may appear on top of the letters you are typing. To make the letters wrap around the graphic, make sure the graphic is selected and then pick Text Wrap from the Options menu. Select anything except the default, and the text will wrap around the picture like an illustration on a web page. Resize the graphic in the same fashion. This gives a much more professional look to your document and allows you to fit more information in less space.
Inserting tables
Next, when pasting tab-delimited text into a word processor, you can take two approaches.
Pasting as text
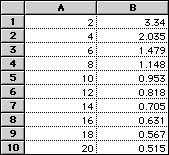
The first approach is to simply paste it in the document as text. That approach yields information that is readable, but not pretty:
2.0     3.340
4.0     2.035
6.0     1.479
8.0     1.148
10.0    0.953
12.0    0.818
14.0    0.705
16.0    0.631
18.0    0.567
20.0    0.515
For one thing, the decimal points on the left column do not align, and if the numbers were not all approximately the same width on the right, they wouldn’t align either. The first step is to select the data table with the mouse, and then use the decimal tab setting function. These tabs are on the tool bar at the top of the document where the centering button and line space controls are. The decimal tab button looks like this: ![]() . Drag the tab down to the ruler at the top of the document and release it where you want the decimal points to align.
. Drag the tab down to the ruler at the top of the document and release it where you want the decimal points to align.
In the case where you have many pages of repeating data to display, you may want to insert a section break above and below the table, then use the column tool to make the data appear in two or more columns. Data will flow from the first column to the second and so on. The column tool is right next to the decimal tab button.
Pasting a spreadsheet in a word processor document
 The other method takes advantage of the fact you can paste a spreadsheet document directly into a word processor document. What you do here is to use the chart tool
 ![]() on the tool bar to draw a box approximately the right size, then paste into cell A1. Then you can adjust the table to show exactly the data you have.
on the tool bar to draw a box approximately the right size, then paste into cell A1. Then you can adjust the table to show exactly the data you have.
Clicking on the spreadsheet brings up the spreadsheet editing menus. When the chart is selected, you will probably want to eliminate the column headings, so select Display from the Options menu, and uncheck the column and row headings boxes. (Took a while to find that one.)
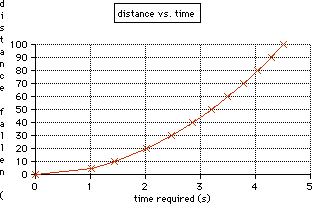
Graph created in AppleWorks.
If you typed the data in or want to display it a different way than the original program, this method has the advantage of allowing you to make a chart in the usual fashion and control its appearance using AppleWorks instead of using the bitmapped PICT you get by copying and pasting to the clipboard. The AppleWorks charts are object-oriented and will look better when printed.
Keep looking for future advanced AppleWorks tips in future Mac Lab Reports.
Go to Using Logger Pro for Experiments.
Keywords: #appleworks #clarisworks
Short link: http://goo.gl/ga47Js
searchword: insertobjectsintoappleworks