This is the second in a series of articles I am writing in support of some staff development meetings I am conducting in the Spring of 2001 for the Antioch Unified School District in California.
In this article, I am going to show how to use the software package Logger Pro to conduct computer-based lab experiments in your classroom, using either the software’s built-in experiment files or by designing your own experiment from scratch. I will conclude with a tutorial on how to insert and modify graphs and data from Logger Pro into AppleWorks.
Today’s Agenda
- Built In Experiment Files
- Calibration
- Designing Your Own Experiment
- Copying data and graphs from Logger Pro
- Experiment Examples
- Appendix: Inserting Pictures, Graphs, and Data in AppleWorks
Built-In Experiment Files
Logger Pro is a program by Vernier Software to take measurements via electronic probes connected to an analog-to-digital interface box, described in last week’s column. Logger Pro requires a Power Macintosh, but simpler versions of its software are available for 68k Macs and even for Apple II series computers. Vernier is a very low-end Mac friendly company, unlike their competitors in the computer sensor software arena.
When you install Logger Pro, a series of setup files are installed. Setup files are instructions to the program telling which probe is connected to what port, using which scale and units of measurement, and so on. Once an experiment is designed, the setup files recall the setup so you do not have to reset the probe configurations in the future.
Vernier has designed a series of experiments ready to use (assuming you have the proper probes and other devices, such as air tracks or chemicals needed). These experiments are organized in two different ways.
The first batch is organized according to a series of manuals called Physics with Computers, Biology with Computers, Physical Science with Computers, and Chemistry with Computers. Each book has roughly 30 experiments in the approximate order you might expect to do them in a standard science curriculum. These experiments build on each other, and if you don’t do the entire sequence you might find them diverging from your curriculum or methods as time goes by. One advantage they do have is that they include detailed step-by-step procedures for students to use regarding how to connect the sensors, launch the software, click the various buttons, and so on.
I find the other set of experiment files more useful in my classroom. These files are organized by sensor, and in each sensor’s folder are several experiments you can do with that sensor. For example, the motion detector, an ultrasonic sonar device used to measure distance, has the following dialog when you select Open from Logger Pro’s File menu. Each one of these files represents a different function or activity.
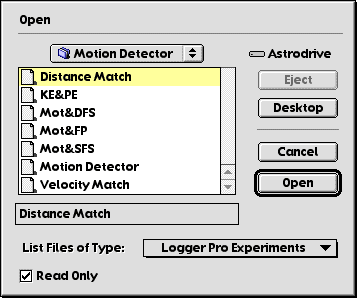
Distance Match, for example, displays a pre-drawn graph that your students must attempt to duplicate while walking in front of the motion detector.
If you’ve never used a motion sensor in a math or science class, there is no better tool for having students learn the relationship between a physical measurement and the plotting of a point on a graph. Many math teachers do a sort of “human graphing” activity where students must walk x feet and then walk y feet, plotting themselves on a grid in the school yard. The motion sensor activity yields real-time data, and students can get a feel for the fact that walking faster increases the slope of the line – thus learning what slope really means rather than just memorizing a definition.
There are ready-to-use settings files for every sensor Vernier makes – and there are a lot of them.
Calibration
Most electronic sensors are excellent at sensing changes in the environment, but like all measuring devices, at some point they need to be calibrated. This means that not only does the device measure changes faithfully, it also records accurate values that would agree with another measuring device. For example, the ultrasonic motion sensor uses sound to measure distance. If the room is hot, sound will travel faster, and the device will consistently underestimate the distances it measures. Therefore, Logger Pro allows you to calibrate or align each sensor with an external standard such as a ruler, thermometer, clock, or whatever the sensor needs. The calibration function walks you through the steps necessary to calibrate each sensor, in a clear, step-by-step fashion.
If all you’re interested in is showing the relative change in a measurement, then the built-in default calibration files should work just fine.
Designing Your Own Experiment
More often than not, Logger Pro’s built-in experiments will require some piece of hardware that you don’t happen to have, or it will require you to spend an inordinate amount of time setting up the equipment. I tend to want to get the experiment done as quickly as possible, so sometimes I set everything up in advance and load the settings file into a public folder on my classroom server. Making the settings file Stationery with the Finder’s Get Info window allows everyone to open it without changing it. I don’t use the books that accompany Logger Pro too much, but that’s mainly a teaching style thing.
When you are ready to design your own experiment, you will be working mainly with the Setup Menu. Selecting Setup Sensors gives you a simplified picture of the ports on the sensor device. This example is for Vernier’s Universal Lab Interface, but there are several interface configurations available.
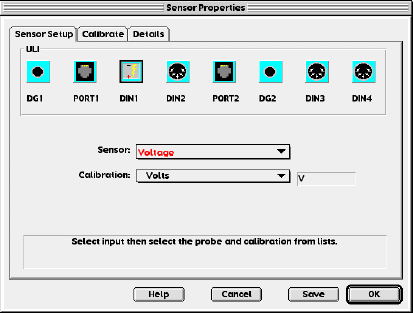
In this illustration, the selected Port DIN-1 has no sensor attached. Unless otherwise instructed, the software defaults to simple raw voltage as the input. Selecting a sensor from the list automatically selects its default calibration file.
If you were going to do an experiment about the brightness of light, for example, you would select Light Sensor from the list.
The Setup Data Collection function lets you control whether or not you are making real-time measurements, measures requiring typed input, the rate of data collection, and the duration of the experiment, if it is timed. This takes a little playing with to understand, and the tutorial files in the Experiment folder can help.
Once the sensor is setup properly and tested, you can save the settings file so that the computer automatically expects that particular sensor and configuration.
The most common mistake made by users of the software is that when the interface box is turned off, the sensors will not respond to the software. The software is ready when a button labeled “Collect” appears. If there is no Collect button, then turning the interface box on does not solve the problem. You must go to the Setup Menu, select Set Up Interface, and ask it to seek the interface box again.
I have recurring, unpredictable success with this fix. Sometimes, the Mac detects the box immediately. Other times, I cannot get it to detect the interface box unless I quit the software and start again with the interface box already turned on.
As mentioned in an earlier column, you should always use the modem port, because any network failure will cause the Mac to revert AppleTalk on the printer port, causing a conflict requiring you to turn off AppleTalk.
If you have used Logger Pro and designed experiments you would like to share, send them along and I’ll post them.
Inserting data and graphs into AppleWorks.
Once an experiment is successfully completed, typically you will either print out the data and attach it to a report, or, as my students are required to do, insert the graph and data into a word processor document as part of a single file.
The main difficulty students have with this step is that they do not understand that the copy function only works for the active window, and either the graph or the data table is active at any one time – not both at the same time. Clicking on the window’s title bar makes the window active, as usual, and you simply copy and paste the graph into AppleWorks.
Pasting the data is more problematic. The data comes across as tab-delimited text without headings, and the default tab stops do not always align the columns properly in AppleWorks. Sometimes there are hundreds of data points, since the computer collects data so quickly, so if left unformatted there may be tens of pages of data displayed in a narrow column on the left side of the page.
Appendix 3 shows how to properly paste these graphs and tables into AppleWorks and control the format.
Experiment Examples
In my 9th grade Physical Science class, I do the following experiments using Logger Pro and Vernier sensor probes:
- Motion Detector: used to teach students how distance and velocity graphs work. Students must move in front of a sonar to make a graph display different types of motion. They learn that slope is speed and that curved graphs imply acceleration on a distance vs. time graph.
- Force sensor/accelerometer: when these probes are attached to a cart, shaking the cart with the force sensor causes an acceleration. Graphing force and acceleration yields a nice straight line graph in support of F=ma: Newton’s Second Law.
- Brightness vs. distance: students use a light sensor to measure the brightness of a small light bulb as a function of distance to discover the inverse-square law for light and also apply this relationship to gravity.
- Voltage and current: students use a variable-voltage power supply to change the voltage on a fixed resistor. The sensors detect voltage and current, and are used to discover Ohm’s law, V=IR.
- Picket fence: When a transparent object with a series of regularly spaced black bars (the pickets) falls through a photogate, the computer can detect how far and how fast it falls to measure the motion of a falling object.
- Temperature vs. time for melting ice: a nice standard chemistry activity shows how temperature changes occur during the phase change of solid to liquid to gas.
There are other experiments, but only so much time. Each year I try to add another sensor to my repertoire.
That’s it for this week. Next week we will change gears, and I will discuss some of the uses of a webcam in the classroom.
Keywords: #loggerpro #maclabreport #digitaldata
Short link: http://goo.gl/8EZald
searchword: usingloggerpro